|
|
|
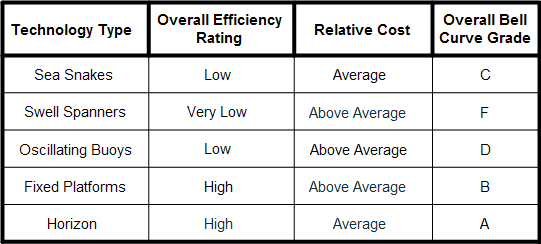
Technology Comparison Chart
The Relative Cost column in the chart does not represent the stated or projected prices of each technology. Rather, it's a reflection of the relative number of expensive redundant parts (like mooring lines, electrical cables, generators, etc.) needed to construct/install 1 MW of capacity.

|


